
.jpg)


Investment Tools is a collection of features that provide a comprehensive summary of a selected area, including administrative information, land values, demographic data, environmental capacity, and livability indicators. Additionally, there's an "Ask AI" feature that uses AI to help users understand the basic conditions of a location before viewing further investment analysis or simulations.
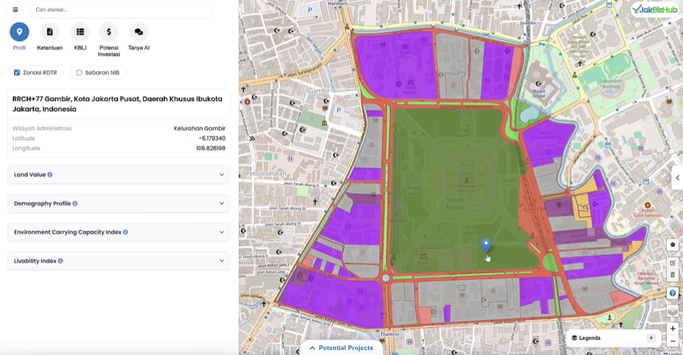
The "Profil" feature provides a comprehensive summary of the selected area, including administrative information, land values, demographic data, environmental capacity, and livability indicators. This feature helps users understand the baseline conditions of the location before conducting further analysis or investment simulations.
 Ketentuan.avif)
The “Ketentuan” feature displays the official regulations, requirements, and rules applicable to a selected location—including zoning regulations, zoning, land use, and building use requirements. This allows users to understand the legal and regulatory restrictions associated with a location before planning a development or investment.
 KBLI.avif)
The "KBLI" feature displays business classification information relevant to the selected location—a list of business codes and types permitted in that area according to the Indonesian Standard Classification of Business Fields. This button allows users to check whether their planned business complies with the zoning regulations in that location.
 Potensi Investasi.avif)
The “Potensi Investasi” feature provides a brief financial and economic projection for the selected location, including estimated investment value, potential returns, and cost factors. This helps users assess the financial feasibility of investing in that area.
Tanya AI.avif)
The "Tanya AI" feature allows users to request automated assistance from the system for answers or explanations related to locations or data on the map—for example, regulations, investment potential, zoning interpretations, or recommendations based on user input. This feature helps accelerate understanding and decision-making without having to manually search for documents or regulations.
 Potential Projects.avif)
The “Potential Projects” feature shows a list or overview of suggested projects and development opportunities for the selected location, such as the 3D models, the exact location, and additional information, helping users explore viable investment options based on local conditions and data.
Support Tools is a collection of features that provide users with interactive controls for drawing and modifying polygons, accessing KBLI information, changing the basemap display, and adjusting the zoom level. This feature set supports deeper spatial analysis and helps users navigate Jakarta's geospatial data more intuitively and efficiently.
 Dashboard KBLI.avif)
The KBLI dashboard displays a summary of business data around a selected location, including the distribution of business sectors, the number of KBLIs per sector, and a list of the most frequently occurring KBLIs. Through graphical and tabular visualizations, users can quickly understand the characteristics of economic activity in the area and assess the potential for business development or investment.
 Kustomisasi Poligon.avif)
The "Kustomisasi Poligon" feature allows users to create, modify, and delete shapes of areas drawn on the map. This feature allows users to move points, add or remove vertices, and adjust the boundaries of the area to ensure more accurate imagery before analysis or downloading.
 Navigasi Peta.avif)
The "Navigasi Peta" feature allows users to change the map orientation. This feature includes selecting basemaps and adjusting the zoom in and out settings, allowing users to navigate the map and adjust the display for ease of viewing.
The KBLI dashboard displays a summary of business data around a selected location, including the distribution of business sectors, the number of KBLIs per sector, and a list of the most frequently occurring KBLIs. Through graphical and tabular visualizations, users can quickly understand the characteristics of economic activity in the area and assess the potential for business development or investment.
The "Kustomisasi Poligon" feature allows users to create, modify, and delete shapes of areas drawn on the map. This feature allows users to move points, add or remove vertices, and adjust the boundaries of the area to ensure more accurate imagery before analysis or downloading.
The "Navigasi Peta" feature allows users to change the map orientation. This feature includes selecting basemaps and adjusting the zoom in and out settings, allowing users to navigate the map and adjust the display for ease of viewing.
